The following is an archive from a project that we'd been working on. The facts and results in this posts haven't been confirmed as yet, at the moment it is just an hypothesis.
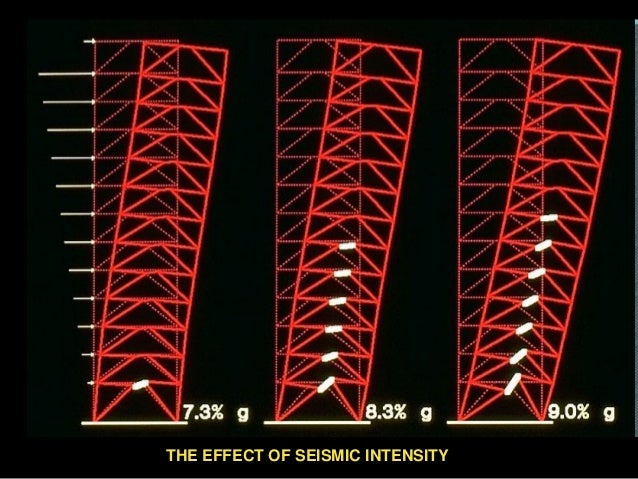
Seismic action introduces horizontal thrust in the structure which tends to move the building in the horizontal plane. This induces a shear in the vertical members and also flexural strains in the local members.
This induced stress has a tendency to dislodge the structure if not dealt efficiently. For every action, there is an equal and opposite reaction as per Newton's law.
When the buildings are struck by a seismic action due to the change in the state of the object i.e change from the inertia of rest to a forced oscillation. The inertia force provides the reaction. And it is this reaction that adds up to the damaging effect to the structure.
The seismometer is used to measure earthquake intensity and contains a suspended mass that moves tracing the lines of interial positions on the media, similar buildings could be considered to be suspended mass as well but in the inverse state. The base of the building provides the necessary anchorage to facilitate the pendulum motion. While in motion the pendulum processes energy and to get to a position of rest the pendulum has to dissipate the energy now depending on the anchorage state if the anchorage is yielding there could be a faster dissipation of energy.
Now by calculating the relationship be the pendulum and the motion of building the total energy acting on the building could be estimated. This could provide the real-time energy statistics to buildings which could be used to analyze the risk of failure or disaster relief.
Representing the energy levels in real time on using geospatial models on the map, it could be used by authorities to plan for disaster management and earthquake relief. Areas with high energy levels represent the high-risk areas.
Working principle:
After having the relationship between the scaling factor governing the amplitude magnification effect a database containing the mass of the buildings along with their weights and centroidal distance will be processed. This task of computing the effects shall be programmed and the required solution can be run on a real-time basis as per an algorithm.
The algorithm will run on to determine the relationship constantly and in the second year as it'll be estimating the seismic energy that'll be acting on the buildings and represent them in the geospatial model.
But
Before we could get to that point we needed to have an experience of earthquake ourself, so we decided to develop our own earthquake model and designed a few structures on AutoCAD. We checked out a few models already being made on this concept but most them were found be based on the application of electric motor or vibrators which we didn't find to actually mimic the event of an earthquake. We thought the model should have the same effects such as aftershocks and the dissipating tremors while the energy is being damped.
Our Philosophy
Energy analogy, how the change in the state of one body affects the related bodies in the system. Here in the design of our model, we use a bouncing object as a source of energy for moving striking the system.
The bouncing object will be allowed to fall free under the action of gravity from a certain height and then after a collision with the piston, it'll move the assembly which in turn will move the base of the table as if there is an earthquake. Now as the system is kind of an elastic state the object will dissipate its potential energy in a couple of other bounces and hitting the piston which will again move the base mimicking the aftershocks or tremors that occur after a major earthquake event.In this way, once the complete energy of the object is lost it'll assume its position at rest and the system will also attain a static condition.
The benefit would be that we can place models on the table and check their stability under conditions, initially we thought of studying the liquefaction of soil and the effect of the geosyntheic material on the strength of the soil.
So now it was conceptually ready, we'd even designed the 3D CAD version of the model
This was basically considering the sides to be transparent so that the sliding of the strata (layers) of the soil and their interaction such as pore changes, voids, etc. could be easily observed.
We then thought of preparing a calibration chart for the height and energy of the bouncing object and its relation to the scaled version of the Richter scale.
This is the exploded 3D view of the design (prototype) developed for better understanding and organization of the objects and shock dissipation devices.
Conclusions
Working on such a project is a great adventure and also enhance the critical thinking capabilities, at present this requires a lot of R&D and investment but "We'll Build It Soon". Having such a model for illustration purposes can really help students in getting interactive and learning better about the phenomenon and deriving solutions to serve humanity...
I'd like to thank Prof. Noorina Tarrannum for guiding and providing the necessary support throughout the course of the project.
You can review the preprint here
Thanks for Reading


